
Inflammation and AgeDiffs at the Cellular Level
The study explores the relationship between inflammation and AgeDiffs at the cellular level. Using CIBERSORT, it was found that the monocyte fraction was significantly positively associated with FacePlsAgeDiff, and this direction was consistent, though not significant, with the other three AgeDiffs across all individuals. Further analysis showed that monocyte count was even more significantly associated with FacePlsAgeDiff, particularly notable in comparisons between the top and bottom 20% of samples. PLSR components 1 and 2 of 3D facial images regressed to monocyte fractions most significantly mapped to forehead shrinkage. This is consistent with the negative association between inflammatory biomarkers, such as interleukin-6, osteoprotegerin, and tumor necrosis factor-α, and brain volume as measured by MRI.The Cell Metabolism study utilizes thermal scanning to capture facial temperature data, providing a new dimension for analysis beyond traditional limitations.
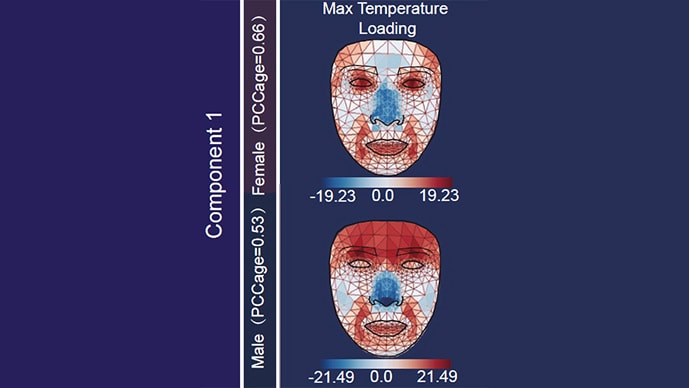
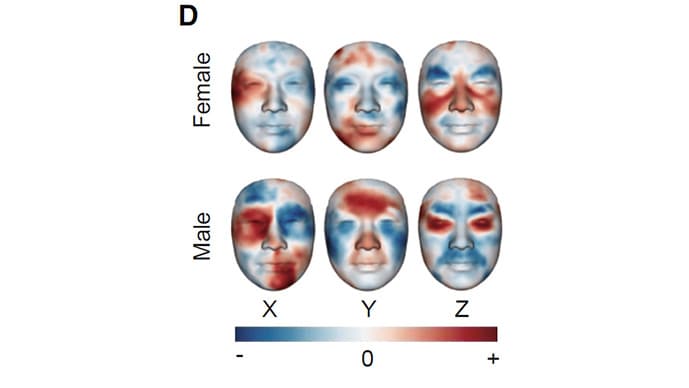 With age comes a shift in facial temperature. Notably, the nose and cheeks show a decrease in temperature.
CD4+ T Cells and AgeDiffs
In contrast, naive CD4+ T cells were consistently negatively associated with all four AgeDiffs. However, the association was significant only for FacePlsAgeDiff and RnaPlsAgeDiff. The PLSR components 1 and 2 of 3D facial changes to this cell fraction showed mapping to a reduction of under-eye puffiness. Additionally, both CNN-derived AgeDiffs were significantly associated with the mean corpuscular volume (MCV) of erythrocytes, a known indicator of chronic illness positively associated with aging, nutrition, and alcohol abuse.
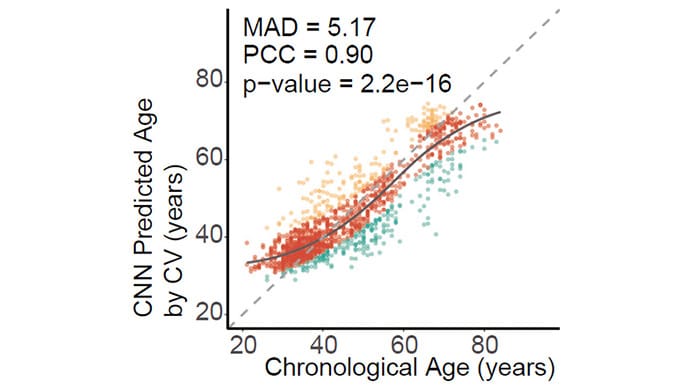
Lifestyle, Transcriptome, and AgeDiff
The study leveraged data from the Beijing 2012 cohort to examine the molecular mediators of the impact of lifestyle on facial AgeDiff. A causal-inference framework was used to create a tripartite network of lifestyle–transcriptome–AgeDiff. Several cytokines were identified as mediators: SEMA6B and GRN were inferred to mediate the effects of smoking and alcohol on FaceCnnAgeDiff and FacePlsAgeDiff, respectively. The consumption of yogurt was found to negatively affect FaceCnnAgeDiff, mediated by the ZZ-type zinc-finger-containing protein 3 (ZZZ3). For RnaPlsAgeDiff, the consumption of stem and root crops was positively related, mediated by tumor protein p53 (TP53). By looking at facial temperature patterns, researchers could identify people with higher BMI, higher blood pressure, and higher fasting glucose levels. In addition, they used the difference between a person’s actual age and their predicted age (based on facial temperature) as a way to measure illness.
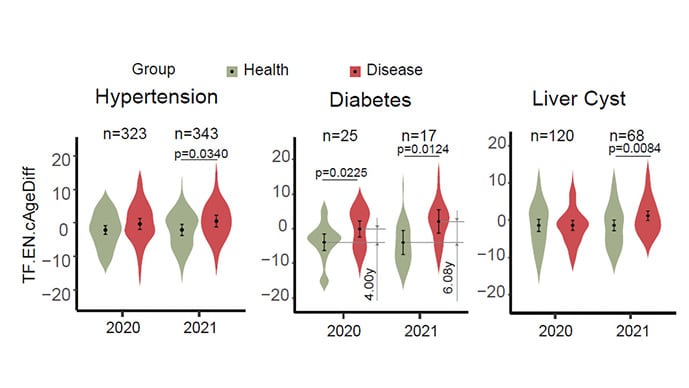
You can see here how, on average, individuals with hypertension, diabetes, and even liver cysts are “older”.
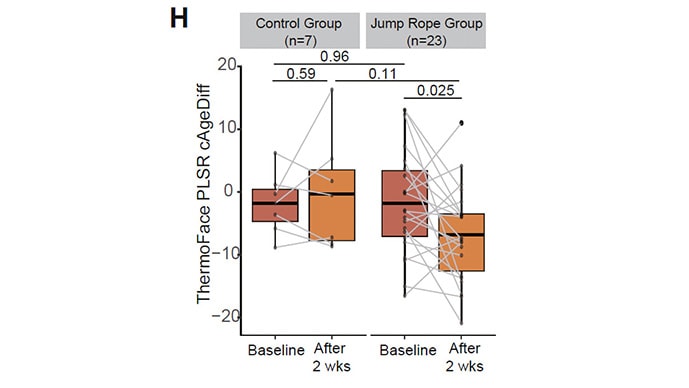
The study even suggests facial temperature could be used as a biofeedback tool. Researchers measured the difference between facial temperature age and real age in a small group before and after two weeks of jump rope training. Interestingly, the results showed that two weeks of jump roping could make you look about 5 years younger based on the thermal camera readings.
RNA Changes and Ageing
Using Ribo-minus RNA sequencing (RNA-seq), the study identified long non-coding RNAs (lncRNAs) and circular RNAs (circRNAs) associated with age. Among the 935 commonly expressed lncRNAs, 62 were upregulated and 210 downregulated by age. For circRNAs, 41 were upregulated and 8 downregulated with age. Despite a higher fraction of total circRNAs during aging, there was no significant association with AgeDiffs, suggesting circRNA accumulation as a consequence of aging.
Outlier Analysis
Applying the causal-inference approach to outliers defined by all four AgeDiffs revealed different associations compared to the whole cohort. Ice-cream intake was positively related to FacePlsAgeDiff and FaceCnnAgeDiff through specific circRNAs and transcription factors, while yogurt was negatively related to FaceCnnAgeDiff and FaceCnnPerceivedAgeDiff.
AI-Based Age Prediction
The study developed CNN models to predict age from 3D facial images with high accuracy in a large cohort. These models identified significant associations between aging, health parameters, and lifestyles, outperforming PLS models in some aspects. The AI predictors, especially those based on perceived age, were superior health estimators. Despite some limitations, such as the focus on Han Chinese individuals and the use of high-resolution 3D imaging, the study advances the goal of identifying actionable lifestyle choices to target aging. The AI technology developed could facilitate monitoring aging rates, benefiting aging populations and intervention strategies, though ethical considerations are necessary to prevent misuse.
Posted July 2024.
Subscribe to our newsletter
Personalised by your preferences, subscribe to our newsletters to get the best of the Pharmaceutical Industry news in your inbox.